
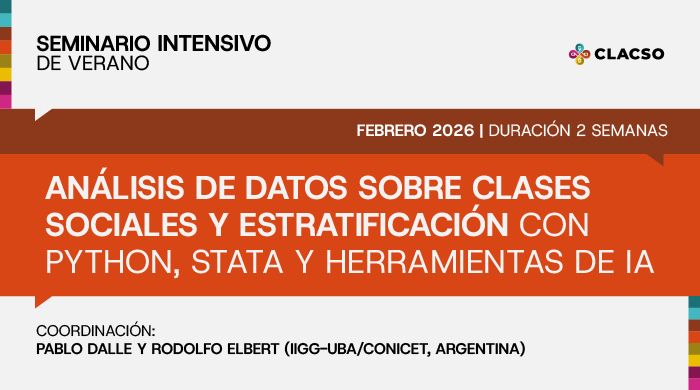
Data analysis on social classes and stratification using Python, Stata, and AI tools
EXECUTIVE
Pablo Dalle y Rodolfo Elbert (IIGG-UBA/CONICET, Argentina)
Home: 23 / 02 / 2026 | Registration: 04/12/2025 al 22/02/2026
Format: Virtual with live classes and exclusive materials
Workload: 90 hours
Duration: 2 weeks
The seminar aims to provide introductory training in the analysis of statistical data on inequalities from the perspective of social class and other axes of social stratification such as gender, ethnicity, and age groups. Throughout the seminar, students will incorporate programming tools in Python and Stata, supported by Artificial Intelligence (AI) assistants.
The goal is to develop syntaxes/scripts that allow for seamless integration between different programming languages/statistical analysis software. We will work on various stages of statistical analysis: i. tools for processing and editing databases, ii. analysis and visualization of descriptive data, and iii. development of multivariate inferential statistical models.
The seminar has a practical focus; through individual and group practical work, it will seek to develop skills to work with databases of surveys on social classes and social stratification of probabilistic sample design.
Class 1: Introduction to the Python program. Basic Python concepts in Google Colab. Libraries, objects, and scripts.
Class 2: Processing and editing databases with Python. Translating files between Python, Excel, and Stata using Google Colab.
Class 3: Descriptive analysis of categorical and quantitative variables with Stata. Construction of complex variables. Re-categorization.
Class 4: Construction of key independent variables to study inequality: social classes, occupational status, ethnic origin, age cohorts, gender.
Univariate analysis (measures of central tendency, position, dispersion) and bivariate analysis (contingency tables) in Stata.
Class 5: Correlation and simple linear regression. Graphs. Analysis with Stata.
Class 6: Multiple linear regression. Graphs. Analysis with Stata.
Class 7: Bivariate and trivariate analysis of contingency tables in Stata. Introduction to logistic regression models. Odds ratios.
Class 8: Multivariate logistic regression models in Stata.
Lesson 9: Data Visualization. Histograms, box plots and other types of graphs in Python (Matplotlib).
Class 10: Hypothesis testing. Contrast between statistical models. Analysis of goodness of fit, choice of the most appropriate statistical model. The role of theory.
The course will be delivered online, combining synchronous and asynchronous sessions. Over the two weeks, a total of ten classes will be taught, eight of which will be live and two will be available as recordings for asynchronous viewing.
Live classes will be held via Zoom, allowing for direct interaction among participants. In addition, students will have access to exclusive materials, available in the virtual classroom, to complement the content covered in each session.
|
Early registration (until 19/01) |
General registration (May 6th to May 29st) |
Registration without discount (30/01 to 22/02) |
|
|
Full or Associate Member Center |
$85 |
$100 |
$150 |
|
No link |
$105 |
$120 |
$190 |
Inquiries: [mail protected]